Biotechnology has traditionally been an industry where companies raise large amounts of capital, spend years developing drugs, and hope that a small number of successful treatments justify the cost of everything that failed along the way. Employees are generally compensated through salaries, annual bonuses, and stock options. Their financial outcomes depend largely on the performance of the company as a whole, even when their work is concentrated on a single drug or research program.
Over the past two decades, a growing number of companies have experimented with a different structure. Instead of organizing all their research inside one company, they divide drug development into smaller businesses, give teams more ownership over individual programs, and sometimes tie compensation to specific scientific or financial outcomes.
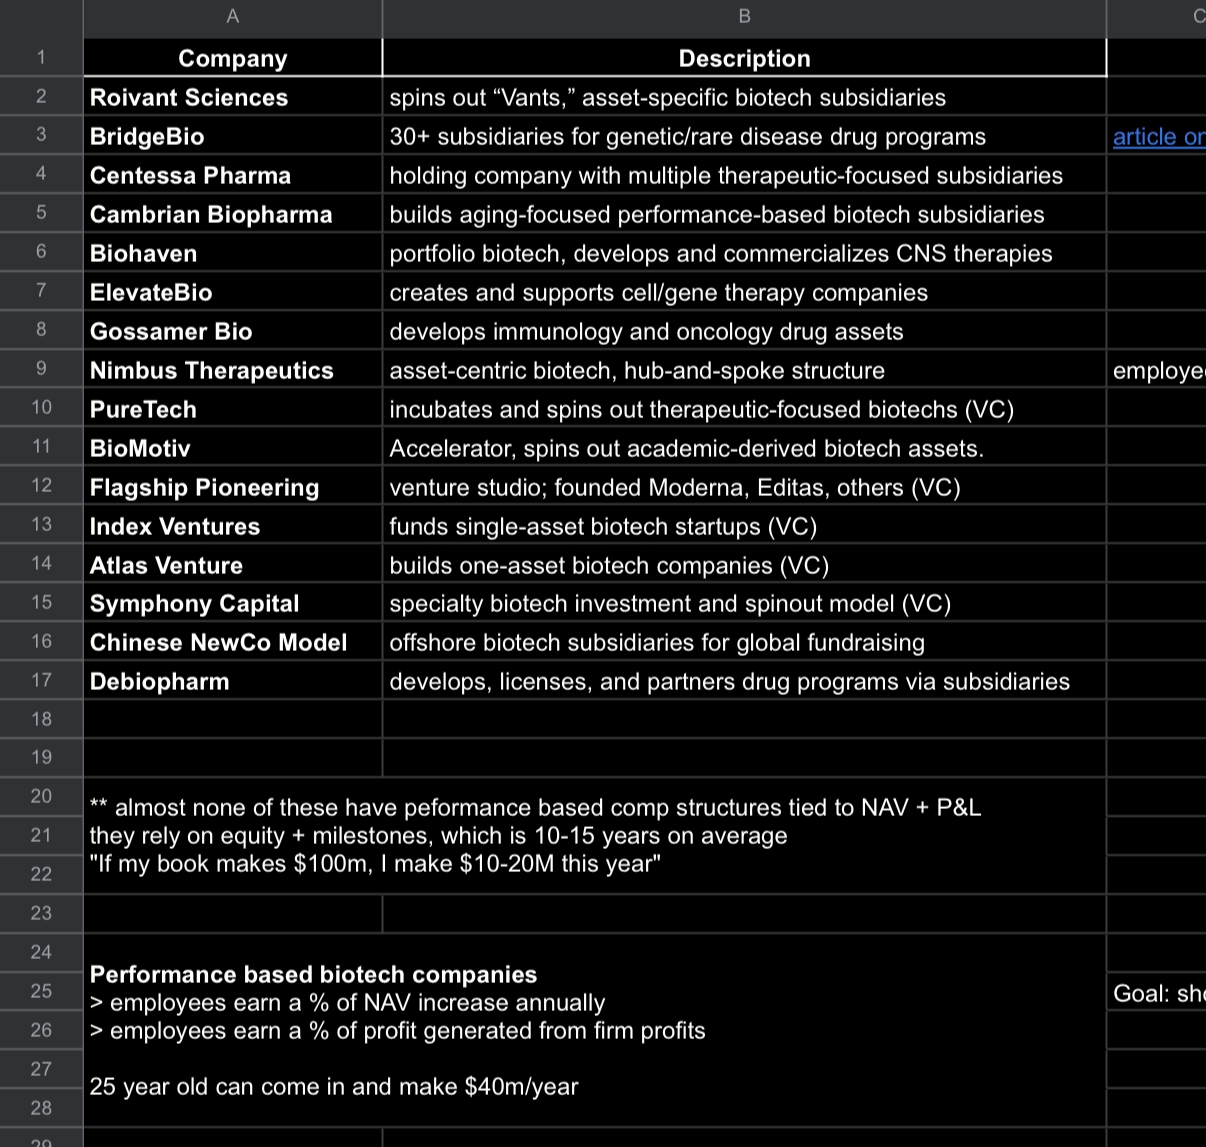
The idea resembles how hedge funds and quantitative trading firms operate. In those businesses, a team can be rewarded based on the returns it generates, sometimes receiving a direct share of the profits attributable to its work. We wanted to understand whether biotech companies adopting similar principles are actually outperforming their traditional counterparts.
The results are interesting, although they are less straightforward than the success stories might suggest.
Between March 2022 and March 2026, a hypothetical $100 investment in Roivant Sciences grew to $561, compared with $145 invested in its biotechnology industry benchmark. Roivant also sold one of its subsidiaries, Telavant, to Roche for $7.1 billion upfront, with another $150 million tied to a milestone. Nimbus Therapeutics sold a drug-development subsidiary to Takeda for $4 billion upfront, with up to $2 billion in additional payments. BridgeBio brought a treatment through FDA approval and generated $362.4 million in U.S. product revenue in 2025. Centessa Pharmaceuticals was acquired by Eli Lilly in June 2026 for approximately $6.3 billion upfront, with additional contingent payments.
These are substantial outcomes, particularly in an industry where most experimental drugs never reach the market. But when we look at how these companies actually compensate their employees, the distinction becomes important. Many have changed how drug development is organized without fundamentally changing how the people doing the work are paid. They still rely on conventional equity, bonuses, and milestone awards rather than giving employees a direct percentage of the economic value they generate.
There are also companies using variations of these structures that have performed poorly. Gossamer Bio lost approximately 98.8% of its market value over the five years ending in November 2026. The newer Biohaven, created after Pfizer acquired the original company, experienced large swings in valuation, including a substantial decline in 2025.
So the question is more specific than whether these companies have produced successful drugs or valuable acquisitions. We want to know whether changing the incentives themselves improves performance, and whether the results are better than what we would expect from traditional biotech companies operating under similar conditions.
How different are the incentives?
To compare these companies, we first need to distinguish between several ways of compensating employees.
At one end is the conventional biotechnology model. Employees receive salaries and equity that generally becomes theirs over time. Annual bonuses may depend on company performance, but an individual scientist's compensation is rarely tied directly to the economic return on the specific program they helped develop.
A more performance-oriented company might award additional compensation when a drug reaches a particular development milestone, such as successfully completing a clinical trial or receiving regulatory approval. Further along, a company might give a team ownership in the individual program it is developing, so that the team participates in the value created when that program is sold or commercialized.
At the other end is the structure more familiar to quantitative finance, where compensation can depend explicitly on profits, increases in net asset value, or investment returns adjusted for the risk and capital required to generate them.
We divided these arrangements into five levels:
Level | Compensation structure | What we found |
0 | Salary and equity that vests over time | Common across traditional biotech |
1 | Company-wide performance bonuses | Extremely common |
2 | Compensation tied to scientific or regulatory milestones | Clearly documented at BridgeBio and in some other development programs |
3 | Ownership or profit participation in individual programs | Present in some venture and asset-development structures, but less common for ordinary employees |
4 | Compensation tied explicitly to realized profits, net asset value, or risk-adjusted returns | Documented in investment management, with limited evidence of widespread adoption in operating biotech |
This classification is a way to organize the evidence, rather than an established industry standard. It also reveals that many companies described as performance-based are still operating primarily at Levels 1 and 2.
BridgeBio is one of the clearest examples of the second level. Its filings describe compensation arrangements for employees and consultants in which cash or equity awards become payable when specific development or regulatory milestones are achieved. This gives the people working on a program a more direct financial interest in whether it advances.
Roivant goes further in linking senior management compensation to the value of the company. Its 2026 filings describe large awards of performance restricted stock units, which are shares that become available only after specified conditions are met. In June 2026, the final share-price condition was satisfied when the company's 30-day volume-weighted average share price exceeded $30. All 43.35 million shares granted under the senior executive program had then satisfied their performance conditions. Roivant's compensation committee also compares executive talent markets with financial services, private equity, and venture capital, rather than looking exclusively at other biotechnology companies.
PureTech Health has a similarly explicit system. According to its 2025 annual report, long-term performance awards are determined by three components: 30% depends on the company's absolute shareholder return, 20% on its return relative to other investments, and 50% on strategic objectives. Its annual bonus can reach 100% of salary, based on financial and strategic performance. This makes compensation more sensitive to outcomes, although employees are still being rewarded largely for company-wide performance rather than the profits of individual programs.
Centessa describes its organization as performance-based, but its disclosed compensation is closer to the conventional model. Annual bonuses and equity awards reflect performance, while some executive stock options depend primarily on continued employment. Its 2025 remuneration report explicitly states that certain options had no performance conditions beyond service obligations.
Biohaven also relies heavily on equity. Its management emphasizes that stock options only create value when the share price rises, which aligns executives with shareholders. But its disclosed 2025 option and restricted-stock awards vest over time, rather than paying employees a defined percentage of profits from individual programs. Gossamer's equity plans similarly emphasize attracting, retaining, and motivating employees, with awards generally tied to employment and service.
Cambrian Biopharma's recruiting materials describe a combination of base salary, performance-based bonuses, and four-year employee stock options. This gives employees some exposure to company performance, but it remains quite different from the profit-sharing arrangements we are investigating.
The closest documented examples of the fourth level come from investment management itself.
Historical SEC disclosures associated with Symphony investment professionals describe compensation funded by asset-based and performance fees. Investment performance was measured against benchmarks and peer groups on a pretax, risk-adjusted basis, meaning returns were evaluated in relation to the risk taken to produce them. Some employees also held profit interests in the business.
Flagship Pioneering, which creates and finances biotechnology companies, also manages carried-interest allocations as part of its compensation infrastructure. Carried interest gives investment professionals a share of profits generated by an investment fund, generally after specified conditions have been met. Public disclosures do not establish the exact percentages paid to individual employees or how sensitively their compensation responds to investment performance.
The distinction matters because ownership in a company, compensation for reaching a milestone, and participation in the profits of a specific investment are three different incentives. They may all encourage employees to work toward valuable outcomes, but they reward different behaviors and operate over different time horizons.
What do the financial results show?
Roivant provides the clearest publicly documented example of substantial shareholder outperformance.
In its 2026 proxy statement, the company reports that a hypothetical $100 investment made on March 31, 2022 would have grown to $561 by March 31, 2026. The same investment in the Nasdaq Biotechnology Index, used as its industry benchmark, would have grown to $145.
Investment | Starting value | Value after four years | Cumulative return | Annualized return |
Roivant Sciences | $100 | $561 | +461% | 53.9% |
Nasdaq Biotechnology Index | $100 | $145 | +45% | 9.7% |
Roivant outperformed the index by 416 percentage points over the four-year period. Its annualized return was approximately 53.9%, compared with 9.7% for the benchmark.
The annualized figures are calculated by taking the fourth root of the ending investment multiple and subtracting one:
[
\text{Annualized return}=\left(\frac{\text{Ending value}}{\text{Starting value}}\right)^{1/4}-1
]
This converts the total four-year return into the equivalent yearly compounded return. It makes investments with different holding periods easier to compare.
Roivant's performance was accompanied by a particularly valuable transaction. In December 2023, Roche acquired Telavant, a subsidiary developing a treatment for inflammatory diseases, for approximately $7.1 billion upfront and an additional $150 million tied to a milestone. Roivant owned 75% of Telavant before the sale and reported receiving approximately $5.2 billion in cash at closing.
The transaction demonstrates one advantage of separating drug-development programs into individual companies. A successful program can be sold independently, allowing its owners to realize value without having to sell the entire organization or wait for every other program to succeed.
BridgeBio offers another positive example, although the financial comparison is less dramatic.
Its reported five-year shareholder return through late October 2026 was approximately 38.9%. Over a similar, though not identical, period ending November 13, 2026, the SPDR S&P Biotech ETF (XBI) returned approximately 22.3%. The difference is roughly 16–17 percentage points, but the observation dates differ by several weeks, so we should treat it as an approximate comparison rather than a precisely matched excess return.
BridgeBio also has an operating result that is arguably more important than its stock performance. In November 2024, the FDA approved acoramidis, marketed as Attruby, for transthyretin amyloid cardiomyopathy. In 2025, BridgeBio reported $362.4 million in U.S. product revenue from Attruby, along with $105.0 million in licensing and services revenue associated with European and Japanese approvals and $11.4 million in royalty revenue.
These numbers show that BridgeBio successfully moved a program through development, regulatory approval, and commercialization. Its filings also provide evidence that scientific milestones can directly influence employee compensation.
But we need to be careful about what that combination proves. BridgeBio's success may reflect the diseases it chose to pursue, the quality of its scientific programs, its capital allocation, or its compensation structure. The available data do not isolate the contribution of each factor.
Gossamer Bio provides an important counterexample. Its five-year shareholder return through November 13, 2026 was approximately −98.8%, compared with a positive return of approximately 22.3% for XBI. Its disclosed compensation structure is much closer to conventional salary and equity than to the more explicit profit-sharing arrangements found in finance.
That does not prove conventional compensation caused Gossamer's poor performance. It does show why we cannot evaluate the broader category by selecting only companies with successful acquisitions or strong share-price appreciation.
Biohaven presents a different measurement problem.
In October 2022, Pfizer acquired the original Biohaven for $148.50 in cash per share, representing approximately $11.6 billion of equity consideration. Shareholders also retained an interest in a newly separated Biohaven, receiving one share of the new company for every two shares they held in the original business.
Pfizer subsequently reported paying approximately $11.5 billion for the shares, alongside $863 million in debt repayment and $495 million to redeem preferred stock.
The original transaction generated substantial value, but measuring the investment return requires reconstructing what shareholders actually received: the acquisition proceeds, the new shares distributed in the spin-off, and the subsequent value of those shares.
Simply looking up a five-year return for the current BHVN ticker would be misleading because the current company did not exist before October 2022. The new Biohaven also experienced substantial volatility, including a large decline in 2025.
Centessa is another successful acquisition that illustrates the difference between organizational structure and compensation.
Eli Lilly completed its acquisition of Centessa on June 24, 2026. Shareholders received $38 in cash per share, representing approximately $6.3 billion of upfront equity value, along with a contingent value right worth up to another $9 per share. A contingent value right, or CVR, is an additional payment that becomes payable only if specified future conditions are satisfied. In this case, the potential contingent consideration totaled approximately $1.5 billion.
Centessa began as a collection of biotechnology businesses before narrowing its development portfolio. Its acquisition demonstrates that this approach can generate considerable value. Yet its compensation disclosures show that it largely used conventional equity and annual performance bonuses, rather than direct program-level profit sharing.
Nimbus Therapeutics provides one of the clearest examples of a valuable exit from an individual drug-development subsidiary.
In February 2023, Takeda acquired Nimbus's wholly owned subsidiary developing a TYK2 inhibitor for $4 billion upfront, with two potential $1 billion payments tied to future sales milestones.
Nimbus is privately held, however, and its publicly available disclosures do not provide a complete record of the capital invested across its programs or how employees participated in the transaction. We therefore cannot calculate a reliable internal rate of return or multiple on invested capital.
That missing information is important. A $4 billion sale is a substantial transaction, but the return to investors depends on how much capital was required to produce it, how long that capital was invested, and how much was spent on programs that did not succeed.
PureTech Health provides another interesting measure, this time from clinical development rather than financial markets.
In its 2025 annual report, PureTech reported a nearly 80% clinical-trial success rate across its model and noted that three therapeutic candidates originating from its portfolio had received FDA approval.
The figure is encouraging, but the company defines its own group of programs and trials. It is therefore not directly comparable to industry-wide estimates that follow drug candidates from the beginning of clinical development through eventual approval.
To understand how unusual any company's performance is, we need a common benchmark.
How often does traditional biotech succeed?
One of the most useful reference points comes from a study by BIO, Informa Pharma Intelligence, and QLS Advisors, which examined drug-development outcomes between 2011 and 2020.
The researchers analyzed 12,728 clinical phase transitions across 9,704 development programs from 1,779 companies. They found that only 7.9% of programs entering Phase I eventually received regulatory approval. The average time from Phase I to approval was approximately 10.5 years.
The probability of advancing also varied considerably across development stages.
Development stage | Probability of advancing |
Phase I to Phase II | 52.0% |
Phase II to Phase III | 28.9% |
Phase III to regulatory filing | 57.8% |
Regulatory filing to approval | 90.6% |
Phase I through eventual approval | 7.9% |
Source: BIO, Informa Pharma Intelligence, and QLS Advisors, 2011–2020 clinical development analysis.
Phase II is particularly difficult. This is generally where researchers begin testing whether a treatment produces the intended clinical benefit in patients, after earlier studies have focused heavily on safety and dosing. Fewer than three in ten programs advanced from Phase II to Phase III during the study period.
These numbers help explain why biotechnology requires so much capital and why companies can spend years developing programs that ultimately fail.
They also show why comparing drug developers without considering what they are developing can produce misleading conclusions.
The same study found that programs targeting rare diseases had a 17.0% probability of progressing from Phase I to approval, compared with 5.9% for high-prevalence chronic diseases. Immuno-oncology programs had a 12.4% likelihood of approval, compared with 5.3% for oncology programs overall.
A company developing treatments for genetically well-understood rare diseases may therefore achieve a higher approval rate than a company working on difficult, common diseases, even if both organizations are equally effective.
If we want to determine whether incentives improve scientific productivity, we need to compare companies pursuing similar diseases, using similar technologies, and beginning at comparable stages of development.
Otherwise, we risk attributing differences in scientific difficulty to differences in management.
Comparing the companies
The companies we investigated do not all operate in the same way. Some are publicly traded drug developers, others are private companies that create and sell individual drug programs, and several are venture capital firms that finance or establish biotechnology businesses.
Their financial performance must therefore be evaluated differently.
A publicly traded company can be measured through shareholder returns. A private drug developer may be evaluated through acquisition proceeds relative to invested capital. A venture fund is generally evaluated through measures such as internal rate of return, which accounts for the timing of investments and distributions, and multiples on invested capital, which compare the value generated with the money invested.
For funds, two additional measures are useful. DPI, or distributions to paid-in capital, measures how much cash has actually been returned to investors. TVPI, or total value to paid-in capital, includes both realized distributions and the estimated value of investments that have not yet been sold.
Those measures cannot be substituted for one another. A company may report a high estimated portfolio value while having returned very little cash to investors.
The following table summarizes the available evidence across the organizations in our original research list.
Organization | Organizational structure | Incentive level | Available performance evidence |
Roivant Sciences | Separately managed drug-development subsidiaries, known as Vants | 2–3 | $100 grew to $561 versus $145 for its benchmark; $7.1B Telavant sale |
BridgeBio Pharma | Portfolio of drug-development programs and subsidiaries | 2 | Milestone-linked compensation; FDA approval and commercialization of Attruby |
Centessa Pharmaceuticals | Initially a portfolio of biotech companies, later a focused pipeline | 1–2 | Acquired by Lilly for approximately $6.3B upfront |
Cambrian Biopharma | Portfolio of longevity-focused therapeutics businesses | 1 | Private; no auditable fund-level return publicly disclosed |
Biohaven, original company | Drug-development portfolio | 1 | Approximately $11.6B Pfizer acquisition plus spin-off equity |
Biohaven, new company | Clinical-stage development portfolio | 1 | Substantial share-price volatility and a major 2025 drawdown |
ElevateBio | Cell and gene therapy platform with associated companies | 0–1 | Private; investment returns unavailable |
Gossamer Bio | Clinical-stage therapeutic development | 0–1 | Approximately −98.8% five-year shareholder return |
Nimbus Therapeutics | Drug programs organized into asset-focused subsidiaries | 3 structurally; employee compensation unverified | $4B upfront Takeda acquisition plus up to $2B in milestones |
PureTech Health | Portfolio of separately developed therapeutic businesses | 2 | Nearly 80% company-reported clinical-trial success; performance-linked long-term compensation |
BioMotiv | Drug-development accelerator | 3 historically | Historical 80/20 investor-management distribution concept; current audited returns unavailable |
Flagship Pioneering | Venture creation and investment | 4 at fund level | Carried-interest structure; complete fund returns not publicly available |
Index Ventures | Venture capital investment | 4 structurally at fund level | Biotech-specific investment returns not publicly auditable |
Atlas Venture | Biotechnology venture creation and investment | 4 structurally at fund level | $450M Fund XIV; complete net return history unavailable |
Symphony Capital / investment-management analogue | Investment management | 4 | Historical compensation tied to performance fees and risk-adjusted returns |
Chinese NewCo model | Drug assets licensed into separately financed companies | 3 structurally | Kailera formed with $400M financing; Hengrui retained approximately 20% ownership |
Debiopharm | Acquires or licenses drug candidates, develops them, and partners with larger companies | Unverified, approximately 0–1 | Private; no audited public investment-return dataset |
Sources: company filings, annual reports, compensation disclosures, acquisition announcements, and investment documentation referenced throughout the original research.
Several companies deserve additional attention because their structures reveal different ways of allocating capital and rewarding outcomes.
BioMotiv historically described an arrangement in which investment proceeds would be distributed using an 80/20 division between investors and management. This resembles the carried-interest arrangements used in investment funds, although current audited returns and detailed employee-level allocations are not publicly available.
Flagship Pioneering and Atlas Venture operate closer to venture capital than conventional biotechnology. Their investment professionals participate in fund economics, while the companies they create generally have their own management teams and employee compensation structures. Atlas raised $450 million for Fund XIV, but the publicly available information does not provide a complete net return history that would allow a reliable comparison with conventional biotechnology investments.
Index Ventures similarly operates as an investment manager, making its fund-level incentive structure fundamentally different from the compensation paid to scientists working inside its portfolio companies. Public information is insufficient to calculate an independently auditable biotechnology-specific return series.
ElevateBio and Cambrian offer variations of the platform and portfolio model, but the public evidence does not establish that ordinary employees receive a direct share of the profits generated by individual assets. Debiopharm has long operated by licensing drug candidates, developing them, and partnering with larger pharmaceutical companies. Its business model is asset-oriented, but the available disclosures do not establish a comparable profit- or NAV-linked compensation system.
The Chinese NewCo model is particularly interesting because it changes how individual drug assets are financed.
In this structure, a Chinese pharmaceutical company licenses a drug candidate to a newly formed company, often financed by Western venture capital investors. The original developer can receive upfront cash, retain ownership in the new company, and become eligible for additional payments if the drug succeeds.
Kailera Therapeutics is one example. It was formed around assets originating from Hengrui Pharma, with approximately $400 million in financing from investors including Bain Capital Life Sciences, RTW, Atlas, and Lyra. Hengrui received approximately $110 million in upfront and near-term consideration, retained roughly 19.9–20% ownership, and remained eligible for substantial future milestone payments.
This creates a direct economic relationship between the original developer and the value of the program. It also moves much of the subsequent development cost into a separately financed company.
That is a meaningful change to the economics of drug development, even though it does not necessarily mean individual scientists are compensated like quantitative traders.
The numbers behind the comparison
The table below retains the principal quantitative observations and their underlying references. It is intended to make the comparisons auditable rather than requiring readers to rely on the narrative alone.
Company or measure | Reported result | Comparison or interpretation | Source |
Roivant, March 2022–March 2026 | $100 → $561 | Nasdaq Biotechnology Index: $100 → $145 | SEC proxy |
Roivant annualized return | 53.9% | Benchmark: 9.7% | Calculated from SEC values |
Telavant sale to Roche | $7.1B upfront + $150M milestone | Value of individual subsidiary | Roivant/Roche |
Roivant proceeds from Telavant closing | Approximately $5.2B | Cash received at closing | SEC filing |
Nimbus sale to Takeda | $4.0B upfront + up to $2.0B | Asset-level transaction | Nimbus/Takeda |
BridgeBio five-year shareholder return | 38.86% | XBI: 22.29%, with differing observation dates | FinanceCharts/XBI |
BridgeBio 2025 Attruby U.S. revenue | $362.4M | Net product revenue | SEC 10-K |
BridgeBio 2025 R&D expense | $452.0M | Annual research and development expense | SEC 10-K |
Gossamer five-year shareholder return | −98.82% | XBI: +22.29% | FinanceCharts/XBI |
Original Biohaven sale to Pfizer | $148.50/share; approximately $11.6B | Cash acquisition plus spin-off equity | Pfizer |
New Biohaven distribution | 0.5 new share per original share | Required to reconstruct historical returns | SEC prospectus |
Centessa sale to Lilly | $38 cash + up to $9 CVR/share | Approximately $6.3B upfront plus $1.5B contingent | Lilly/SEC |
PureTech clinical success | Nearly 80% | Company-defined cohort; not directly comparable to industry | PureTech annual report |
Industry Phase I-to-approval probability | 7.9% | 9,704 programs, 2011–2020 | BIO/Informa/QLS |
Industry Phase II-to-III transition | 28.9% | 4,933 programs | BIO/Informa/QLS |
Average Phase I-to-approval development time | 10.5 years | Historical industry average | BIO/Informa/QLS |
These figures capture several successful transactions and important differences in shareholder performance. They do not yet provide a complete measure of capital efficiency.
For example, BridgeBio reported $452.0 million in research and development expenses in 2025. That number tells us how much the company spent on research during the year, but it cannot by itself tell us the cost of developing Attruby or the return generated by that program. Those calculations would require assigning historical development expenses to individual assets and accounting for the programs that failed.
The same limitation applies to Nimbus and other privately held companies. Without complete records of capital invested, cash returned, remaining asset values, and investment timing, we cannot calculate reliable multiples or annualized returns.
The absence of those numbers should remain visible in the analysis rather than being replaced with estimates that appear more precise than the evidence allows.
Are the performance-based companies actually better?
We can see that several companies using asset-centered organizational structures have produced unusually valuable outcomes. What we cannot yet establish is whether the incentives caused those outcomes, or whether companies with stronger incentives systematically outperform traditional biotech.
There are several reasons for this.
The first is that we are comparing different kinds of organizations. A publicly traded drug developer, a private biotechnology subsidiary, and a venture capital fund generate different types of financial data. Their returns cannot be combined into a meaningful average without accounting for how capital is invested, valued, and returned.
The second is that the underlying scientific problems vary enormously. As the BIO/Informa/QLS study demonstrates, approval probabilities differ substantially by disease area. They also depend on the type of treatment being developed, the biological target, the novelty of the approach, and whether biomarkers are available to identify suitable patients.
A company focused on genetically validated rare diseases might outperform another company working on difficult oncology programs because it has chosen a more tractable scientific problem. That difference could exist regardless of how employees are compensated.
The third problem is that successful transactions are easier to observe than unsuccessful investments.
Roivant's Telavant sale, Nimbus's TYK2 transaction, the original Biohaven acquisition, and Centessa's sale to Lilly are prominent because they generated billions of dollars. The subsidiaries that failed, the programs that were discontinued, and the capital consumed by unsuccessful experiments are less visible in public transaction announcements.
This is known as survivorship bias. If we count only the programs that were sold, we will overstate the performance of the organizations that created them.
The fourth problem is that the incentive structures themselves are difficult to compare.
A company might give employees stock options, award bonuses for achieving regulatory milestones, and allow its subsidiaries to raise capital independently. Those arrangements may all influence behavior, but they are not equivalent to compensating a team according to the profit it generates after accounting for capital and risk.
With the available public data, we cannot construct a statistically reliable comparison between companies at each incentive level while also controlling for these differences.
We therefore cannot responsibly claim that companies at Levels 3 and 4 outperform those at Levels 0 and 1.
We can, however, identify an organizational pattern that deserves attention.
Roivant, BridgeBio, PureTech, Nimbus, and several Chinese NewCo structures make individual drug programs easier to evaluate as economic units. Capital can be allocated to a particular asset, outside investors can finance it independently, and a successful program can be sold without requiring the sale of the entire organization. BridgeBio also demonstrates that employees can be compensated for achieving identifiable scientific milestones.
These structures may improve the ability to terminate unsuccessful programs, finance promising ones, and determine which teams contributed to a particular outcome.
That is a plausible mechanism for improving capital allocation and decision-making. It remains a hypothesis rather than a demonstrated causal relationship.
The evidence can therefore be divided into three conclusions.
What we can verify: Some biotechnology companies have adopted stronger asset-level accountability and more performance-contingent compensation. Several have generated substantial shareholder returns, regulatory successes, and multibillion-dollar acquisitions.
What appears plausible: Separating drug programs into individual economic units may improve capital allocation, decision speed, and the ability to reward teams for specific outcomes.
What the public evidence does not establish: Employees compensated directly according to profits, increases in net asset value, or risk-adjusted returns systematically produce better drugs, higher clinical success rates, or superior shareholder returns than comparable employees at traditional biotechnology companies.
The final proposition is the most interesting one, and it remains largely untested.
What this means for the next generation of biotech
The distinction between the incentives used in quantitative finance and those used in biotechnology is important because the two industries have historically operated with very different levels of measurable uncertainty.
A quantitative trading firm can observe the results of its decisions continuously. It can measure how much capital a strategy uses, what returns it generates, and how much risk it takes to produce those returns. The firm can then determine how much of that value should be attributed to the people or systems responsible.
Historical Symphony disclosures show compensation linked to performance fees and risk-adjusted investment returns. Flagship and other venture firms use carried interest to give investment professionals a share of the profits generated by their portfolios.
Biotechnology has a much harder attribution problem.
A scientist might spend years developing a molecule before a clinical trial establishes whether it works. A successful clinical team may inherit a program whose outcome was largely determined by decisions made much earlier. A drug can fail because the underlying biological hypothesis was wrong, because the delivery mechanism was inadequate, or because the patient population was poorly selected.
It is difficult to know which decisions created value when the system itself is not sufficiently understood.
That uncertainty also helps explain why biotechnology companies rely so heavily on consensus. When the underlying biological relationships cannot be predicted reliably, people use one another's judgment as evidence. Decisions pass through scientific committees, executive teams, investors, and external experts.
Consensus allows organizations to move forward when the evidence is incomplete. It also makes it harder to attribute decisions to individuals and to reward the people who make unusually good predictions.
This is where the idea of developing the “physics functions of biology” becomes relevant to the economics of the industry.
If we can measure biological processes more continuously, predict how they respond to interventions, and test those predictions quickly, we can begin evaluating individual contributions with greater precision.
We can ask whether a sensor improved our ability to distinguish two molecules, whether a model predicted a biological response more accurately, or whether an intervention produced the intended change in a particular person. We can also measure how much capital and time were required to achieve those improvements.
The better we become at measuring these outcomes, the easier it becomes to compensate people according to the value of their work.
The companies we studied represent different stages in that transition.
Roivant makes drug-development assets economically separable. BridgeBio ties some employee compensation to specific development and regulatory milestones. PureTech links long-term compensation to shareholder returns and strategic objectives. Chinese NewCo structures allow drug assets to be financed and owned independently. Venture capital firms use carried interest to reward investment performance.
Each structure makes some aspect of performance easier to measure or reward. Yet most remain focused on improving the existing process of discovering molecules, developing drugs, conducting clinical trials, and commercializing successful treatments.
We think the larger change becomes possible when the biological output itself can be measured with enough precision to support a different incentive system.
Instead of rewarding people primarily for the time they spend on a project, the milestones they reach, or the overall share price of the company, we could reward them for improving a measurable biological prediction or intervention.
A sensor team could be rewarded for making a previously unreadable signal reliable. A modeling team could be rewarded for improving the accuracy of a prediction. An intervention team could be rewarded for producing a validated biological outcome, with the economic value of that improvement determining how the rewards are distributed.
This would require carefully defined measurements, independent validation, and a way to account for the capital and risk consumed by each contribution. It would also require distinguishing improvements that are genuinely valuable from those that merely optimize a benchmark.
But the principle is familiar from quantitative finance: the more precisely we can measure what a person or team contributes, the more directly we can align their incentives with that contribution.
Conclusion
The evidence does not establish that performance-based biotechnology companies, taken as a group, outperform traditional biotechnology companies.
Several organizations using decentralized development structures have generated extraordinary financial outcomes. Roivant's shareholder performance and Telavant sale, Nimbus's acquisition by Takeda, BridgeBio's commercialization of Attruby, and Centessa's acquisition by Lilly demonstrate that these structures can create substantial value.
But the companies use different compensation systems, and many of their employees are still rewarded through conventional salaries, bonuses, and equity. The publicly available information is insufficient to determine whether stronger performance-based compensation caused the successful outcomes.
The more defensible conclusion is that biotechnology has begun making individual scientific programs easier to finance, measure, and hold accountable. The industry has adopted some of the organizational principles of investment management, while only partially adopting its incentive structures.
We think this distinction matters because the next generation of biotech may have the tools to measure performance at a much finer level.
As sensing, computation, and experimental automation improve, we can begin to understand biological processes with greater certainty. That creates the possibility of making decisions faster, attributing value more accurately, and compensating people according to the biological and economic results they produce.
The existing companies show that the industry is beginning to move in this direction. Whether a more complete performance-based model will outperform traditional biotechnology remains an open question, and one worth testing.